How We Made "Getting Mean About Error"
written by: Miles and Michelle • Sep 19, 2020 • category: dev • 608 words • ~ 3 minute read • Subscribe to RSS feed for blogs
The “Getting Mean About Error” module was a two-quarter-long project that we dove into with a negligible background in web development. Along the way, we picked up a few skills and upgraded our web-dev background from beginner to slightly-less-beginner.
The primary aim of this project is to introduce the statistical concept of Mean Squared Error (MSE) in a beginner-friendly way. That is, we wanted to build a readable and interactive module to kickstart high-school level students’ understanding of machine learning without hurting their heads. We have unbelievably short attention spans ourselves, so we aimed to prioritize simplicity while retaining the integrity of the concept. This was done by using not-so-difficult vocabulary, a larger font, step-by-step animations, and graph examples.
The process of development consisted of content creation, development, testing, and review. First, we received information from ACM AI about the target audience (high school students), the topic of the module (Mean Squared Error), and general sections that the module should include. As developers, we were given the freedom to design the details of the website. This brought us to the planning stage, where we sat down together and decided on content flow, color scheme, supporting graphs, and other structural details. Then, of course, we had to put in the actual work to code all the features on the website. Once we launched our first draft on GitHub, we entered a cycle of testing and review where we would receive weekly feedback on how to improve the website, and go back to development to reflect those ideas and criticisms. We probably learned the most in this stage, and we’re very thankful to our enormous-brained leaders Leo and Matt, and our equally knowledgeable friend Arjun from ACM AI Outreach for their suggestions on how to word certain parts of the lesson, what features should be included, and how the website could best be laid out.
Getting into the technical details, this static web lesson is built off of HTML, CSS, and Javascript. To achieve an elegant page-by-page layout, we used the Bulma framework for CSS styling. We also used several Javascript libraries for further functionalities, which are FunctionPlot (an extension of the popular d3 graphing library) for graphing, Math.js for math-parsing, MathJax for math syntax generation, and anime.js for basic animation. All these frameworks and libraries were very new to us, but we managed to incorporate them cleanly with the help of online documentation and feedback from our peers.
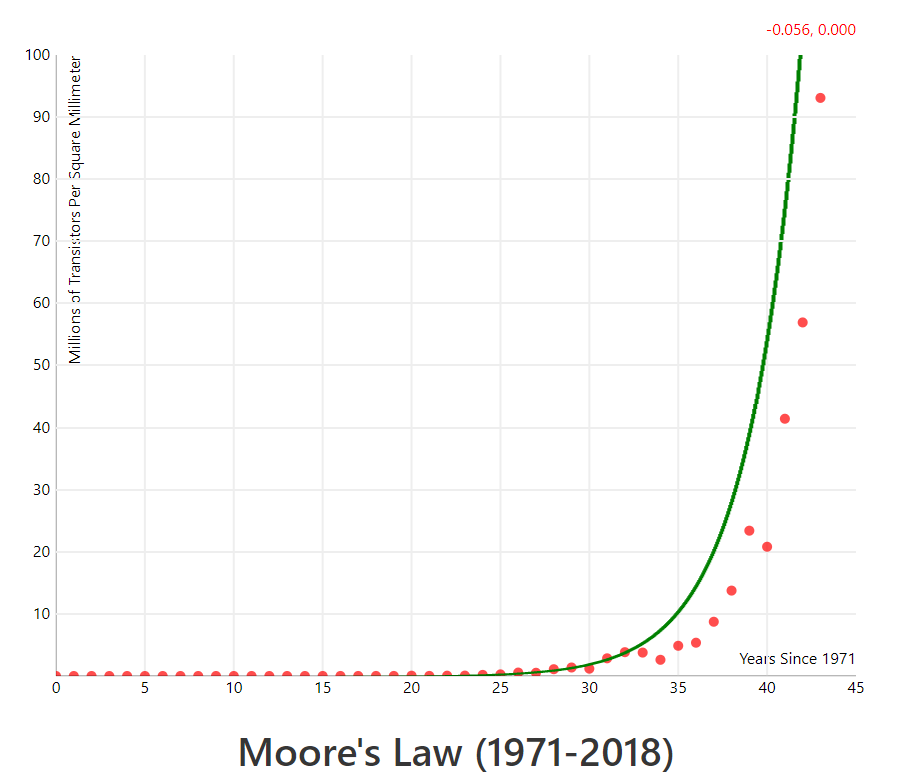
Most of the obstacles we faced came from the limitations of the libraries we were using, most notably FunctionPlot, our graphing library. Looking back, we definitely could have considered other graphing libraries; it was an oversight on our part not to spend enough time thinking about what functionalities we would want from our graphing library. For example, having the points on the graph labeled with their coordinates would have been very helpful, but is not possible (as far as we can tell) using FunctionPlot. The big selling point of FunctionPlot is its extreme precision, but for our purposes, it could have been worth sacrificing anyway. We really only needed points and lines, and a nice, big font. Like, look at this. We don’t need this.
Thanks for reading our short post! If you have any questions or feedback on our project, we’d love to talk to you. Stay safe!
Note: this post was originally finished in June, but went through a few iterations as we implemented the blogs feature. Many thanks to Miles & Michelle for their patience!
Authors